26 06, 2023

Static and dynamic network visualization with R

2023-07-05T16:26:24-04:00June 26th, 2023|Tags: , , , , , , , , , , , , , , , , , , , , , , , , , |

This is a comprehensive tutorial on network visualization with R. It covers data input and formats, visualization basics, parameters and layouts for one-mode and bipartite graphs; dealing with multiplex links, interactive and animated visualization for longitudinal networks; and visualizing networks on geographic maps. To follow the tutorial, download the code and [...]

12 02, 2013

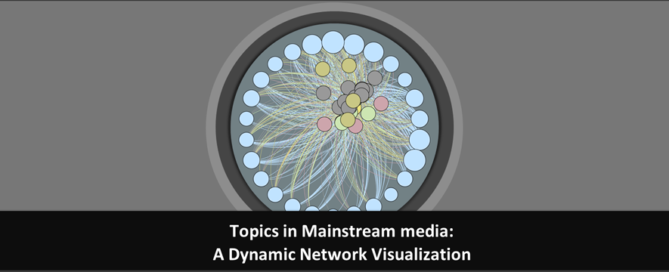
Topics in Mainstream Media: A Dynamic Network Visualization

2018-06-22T00:17:50-04:00February 12th, 2013|Tags: , , , , , , , , , , , , |

My doctoral dissertation (defended a few months back) studies a dynamic network of news outlets and the topics they cover over time. It implements a measure of media fragmentation and uses actor-based modeling to evaluate the impact of economic, political, organizational, and structural forces on certain properties of the media agenda. [...]

21 12, 2012

Intro materials: network analysis software (UCINET, NodeXL, Gephi, Statnet, ERGM, RSiena)

2018-06-15T07:23:46-04:00December 21st, 2012|Tags: , , , , , , , , , , , , , , , , |

In the fall of 2012, I got to design & lead the weekly labs for a network seminar at USC. I also worked on the methods portion of the syllabus for the class. COMM 645: Communication Networks is a PhD-level course taught by Peter Monge. The labs cover a range of [...]

Go to Top