8 06, 2015

The world as seen in political statements

2018-06-15T17:49:13-04:00June 8th, 2015|Tags: , , , , , |

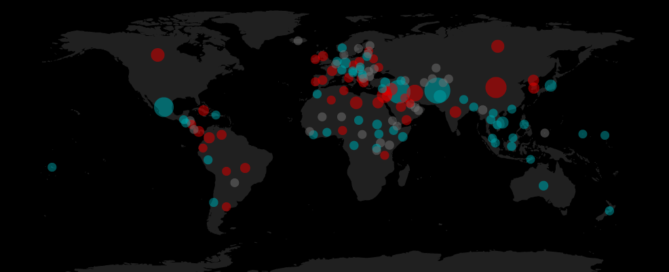
A new Politico post produced by our lab examines the mentions of countries around the globe in congressional documents. We look at the frequency of country mentions and co-occurrence. These numbers were extracted from political statements provided by VoteSmart. Here we post the data we used for those visualizations. The files [...]
20 05, 2015

Term co-occurrence in party documents: Network data from our Politico post

2018-06-15T15:42:17-04:00May 20th, 2015|Tags: , , , , , |

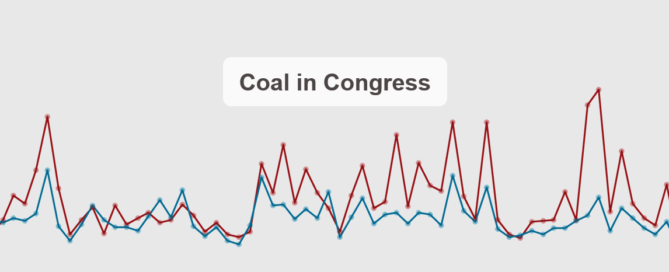
David Lazer, Oren Tsur, and I recently took a look at the use of the term "coal" in documents produced by members of the US Congress. Some numbers and visualizations based on this were published by Politico. Here, we post the data behind the network map of term co-occurrence in coal-related [...]

30 05, 2011

Actors and Links in the Media System: Taking a Network Perspective

2018-06-22T00:53:15-04:00May 30th, 2011|Tags: , , , , , , , , |

Exploring the structure of relationships between news organizations, issues, and audience members is key to understanding the media system.  The paper I'm posting here (just presented at ICA 2011, Boston) looks into a range of network types available to media researchers: inter-organizational, semantic, issue, hyperlink, and social graphs. It discusses important predictors [...]

19 09, 2010

The Future of Journalism: A Network Visualization

2018-06-15T17:56:09-04:00September 19th, 2010|Tags: , , , , |

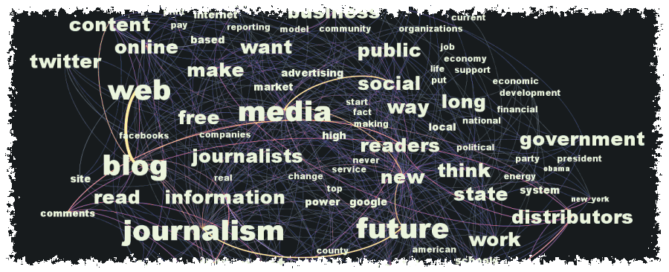
This semantic map takes a cue from Chris Anderson's The-Future-of-Journalism visualization post @ Nieman Lab. CWA makes the fair point that any time we see a dramatic event / scientific discovery /technological innovation occurring, someone will invariably cry out "Oh, but what could that possibly mean for journalism?". The network below [...]

Go to Top