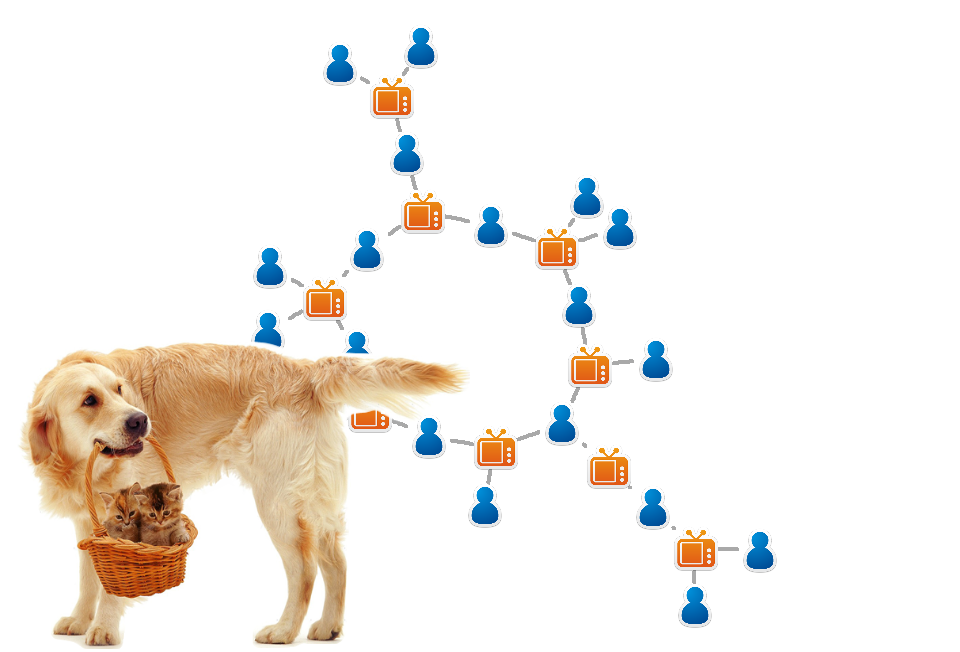
In the next few months, I will be running several network visualization workshops using R and Gephi at Sunbelt 2016 (Newport Beach, CA) and Political Networks (St. Louis, MO). The descriptions follow below – if you are going to one of the conferences, do stop by! By popular demand, the workshops will once again include visualizations featuring baskets full of kittens.
Basic and advanced network visualization with Gephi and R
Sunbelt 2016 Workshop, Newport Beach, CA
Instructors: Katherine Ognyanova (Rutgers University)
Kar-Hai Chu (University of Southern California)
Workshop Length: 2 sessions (6 hours total – attendees can register for one or both sessions)
Session I: Basic and advanced network visualization with Gephi (Ognyanova & Chu)
Session II: Basic and advanced network visualization with R (Ognyanova)
This workshop will cover basic and advanced network visualization techniques.
The first session of the workshop will focus on hands-on training for graph visualization with Gephi (gephi.github.io). No prior knowledge of the software is required. The training will cover formats and input modes for structural and attribute data, visualization parameters, and best practices. It will provide an overview of layout algorithms appropriate for networks with different sizes and characteristics. The second part of this session will deal with advanced topics including dynamic visualization for longitudinal data; working with bipartite and multiplex graphs; and combining networks with geographic data. We will discuss output formats, and cover the use of plugins that facilitate the export of Gephi networks to interactive Web pages.
The second session of the workshop will cover network visualization using the R language for statistical computing (cran.r-project.org) and RStudio (rstudio.com). Participants in that session should have some prior knowledge of R and network concepts. The session will provide a brief overview of network formats, focusing on their structure and representation in key R packages. Attendees will also receive an introduction to major principles of graphics used in the R environment. The workshop will provide a step-by-step guide describing (through series of examples) the path from raw data to graph visualization in the igraph and Statnet frameworks. The advanced portion of this session will introduce dynamic visualization for longitudinal networks; combining networks with geographic maps; and user-designed graph layouts. This section will also discuss ways of converting networks in R to interactive JavaScript/d3-based visualizations for the Web.
Network visualization with R
Polnet 2016: Political Networks Conference, St. Louis, MO
Katherine Ognyanova, Rutgers University
This workshop will cover network visualization using the R language for statistical computing (cran.r-project.org) and RStudio (rstudio.com). Participants should have some prior knowledge of R and network concepts. The session will provide a brief overview of network formats, focusing on their structure and representation in key R packages. Attendees will also receive an introduction to major principles of graphics used in the R environment.
The workshop will provide a step-by-step guide describing (through series of examples) the path from raw data to graph visualization in the igraph and Statnet frameworks. The advanced portion of the workshop will touch on dynamic visualization for longitudinal networks and combining networks with geographic maps. We will also discuss ways of converting graphs in R to interactive JavaScript/d3-based visualizations for the Web.
