Facebook data collection and photo network visualization with Gephi and R

tl;dr
[Update April 26 2o14] Esteban Moro reminded me that there’s no need to manually rescale igraph layouts now – one can use layout.norm() instead (script updated accordingly).
Hugle on GitHub Gist kindly pointed out a couple of sneaky typos – those are now fixed.
Gephi is one of my favorite network visualization tools – it offers a wide variety of customizable layouts, allows for sophisticated tweaks, renders large graphs ok, deals with dynamic data, and generally lets you produce sleek-looking results with minimal effort. That said, there are a few basic things (that pretty much any other network viz tool can do) which I’ve been missing in Gephi: like the ability to combine different node shapes and the option to use images as nodes. Last week, however, the good people from the Yale Computer Graphics Group released a Gephi plugin that can do exactly that. It’s called Image Preview and will allow you to use pictures in your Gephi net viz.
I played around with the plugin for a little while to figure out how it works – and then switched to R to replicate the results I got there. I used my own Facebook network for this exercise – that made it easy to get the pictures for each node. Twitter would have worked just as well, but I also wanted to check out the new version of the RFacebook package. I figured I’d share the steps to getting the data and visualizing it ( in Gephi, igraph, or qgraph) — it turned out to be pretty straightforward with only a couple of glitches along the way.
I should also point out that the same effect can be achieved even faster using any of the many available Facebook apps (e.g. Bernie Hogan‘s NameGenWeb), or with Mark Smith‘s NodeXL network add-on for Excel.
Collecting Facebook Data
1 Registration. The first thing to do is get the Facebook data. Before being allowed to pull it from R, you’ll need to make a quick detour to developers.facebook.com/apps, register as a developer, and create a new app. Name and description are irrelevant, the only thing you need to do is go to Settings → Website → Site URL and fill in http://localhost:1410/ (that’s the port we’re going to be using). The whole process takes ~5 min and is quite painless – if you need a more detailed walkthrough though, check out this blog post by Julian Hillebrand.
2 Authentication. Now you can go to R, install the RFacebook package and get authenticated using the id and secret shown in the Settings tab of your Facebook app.
install.packages("Rfacebook")
library(Rfacebook)
oauth <- fbOAuth(app_id = "your_app_id_here",
                 app_secret = "your_app_secret_here",
                 extended_permissions = T)

save(oauth, file="fb_oauth")
# load(file="fb_oauth")
3 Data download.At this point, you can already get information from Facebook. Using getFriends will give you a data frame that contains (among other things) the name, username, gender, location, hometown, and picture URLs of all Facebook contacts who have provided that information. You can use getNetwork to collect the ties among people on your friend list – either as an edge list, or as an adjacency matrix. Just for the fun of it (and because it doesn’t take very long), we’ll get them both.
# Get friend info:
my.friends <- getFriends(oauth, simplify=F)

# Get friend network in two formats, matrix and edge list:
fb.net.mat <- getNetwork(oauth, format="adj.matrix")+0 # bool,+0 to get numeric
fb.net.el  <- as.data.frame(getNetwork(oauth, format = "edgelist"))
4 Image download. Using the URLs from the Facebook friend dataframe, we can download people’s profile photos and store those in a local folder (here FBImages). The download itself is simple with download.file – most of the script lines below deal with naming the image files properly.
setwd("C:/Research/R")
dir.create("FbImages")

# Image file name and local path stored here:
my.friends$picture.dld <- NA

# Download the images:
for (i in 1:dim(my.friends)[1]) {
  # Fb images appear to be mostly JPEGs, except for people
  # with no profile pics - for those we seem to get a default GIF
  pic.ext <- ".jpg"
  if(grepl(".gif$", my.friends$picture[i])) pic.ext <- ".gif"

  # We'll name files using people's full names plus file extension.
  my.friends$picture.dld[i] <-
                 paste0("FBImages/", sub(" ", "_", my.friends$name[i]), pic.ext)

  # Some users have UTF-8 encoded names that don't work well as file names:
  if (Encoding(my.friends$name[i])=="UTF-8") {
       my.friends$picture.dld[i] <-
                  paste0("FBImages/", "FbID_", my.friends$id[i], pic.ext) }

 download.file(my.friends$picture[i],  my.friends$picture.dld[i],  mode = 'wb')
}
Visualizing the network with Gephi
There are a number of ways to move network data from R to Gephi (both support various formats like gexf). For simple/small networks though, the most straightforward way to export from R is probably as CSV. Gephi needs two CSV files: one containing an edge list describing every link (the columns containing the start node and end node for each link should be named Source and Target). The second file is a node attribute table – it should contain a column named ID with node identifiers corresponding to those used in Source and Target. Any other attributes are generally optional – but here you need to have one called image, containing the photo file names in order for the Image Preview plugin to work.
colnames(fb.net.el) <- c("Source", "Target")
my.friends$ID <- my.friends$name
my.friends$image <- gsub("FBImages/(*.)", "\\1", my.friends$picture.dld)

write.csv(fb.net.el, file="Facebook-friend-EDGES.csv", row.names=F)
write.csv(my.friends, file="Facebook-friend-NODES.csv" row.names=F)
After you import the files (from Data Laboratory → Import Spreadsheet), you can tinker with the layout of the graph in the Overview tab until you’re happy with it, then switch to the Preview tab.
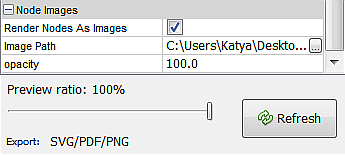
If you have the Image Preview plugin installed, you should see a Node Images section at the bottom of the right-side Preview Settings bar. Tick Render nodes as images and specify the folder where the photos are located in the field below.
Gephi will take the file names stored in the image node attribute, and look for them in the Image path that you’ve set. One glitch I encountered (which the plugin creator Chris Xue kindly helped with) was that the plugin has compatibility issues with Java 7. I had to install Java 6 (download here) and change Gephi’s startup configuration (in Gephi-0.8.2\etc\gephi.conf changing the jdkhome parameter) before the plugin would work.
Visualizing the network with igraph
R has long been able to handle adding images to network graphs (and plots in general). I tried a couple of different packages to do this – both work ok. I’m more familiar with igraph which makes it easier to tweak things there — but qgraph has the node images option built in, so it’s very easy to get a network map with node photos (see the next section – it only takes a few lines of code).
Before doing an igraph visualization using node images, we can plot the graph the old-fashioned way and tweak the layout until it looks ok.
require("png")
require("jpeg")
require("igraph")
fb.net <- graph.adjacency(fb.net.mat)
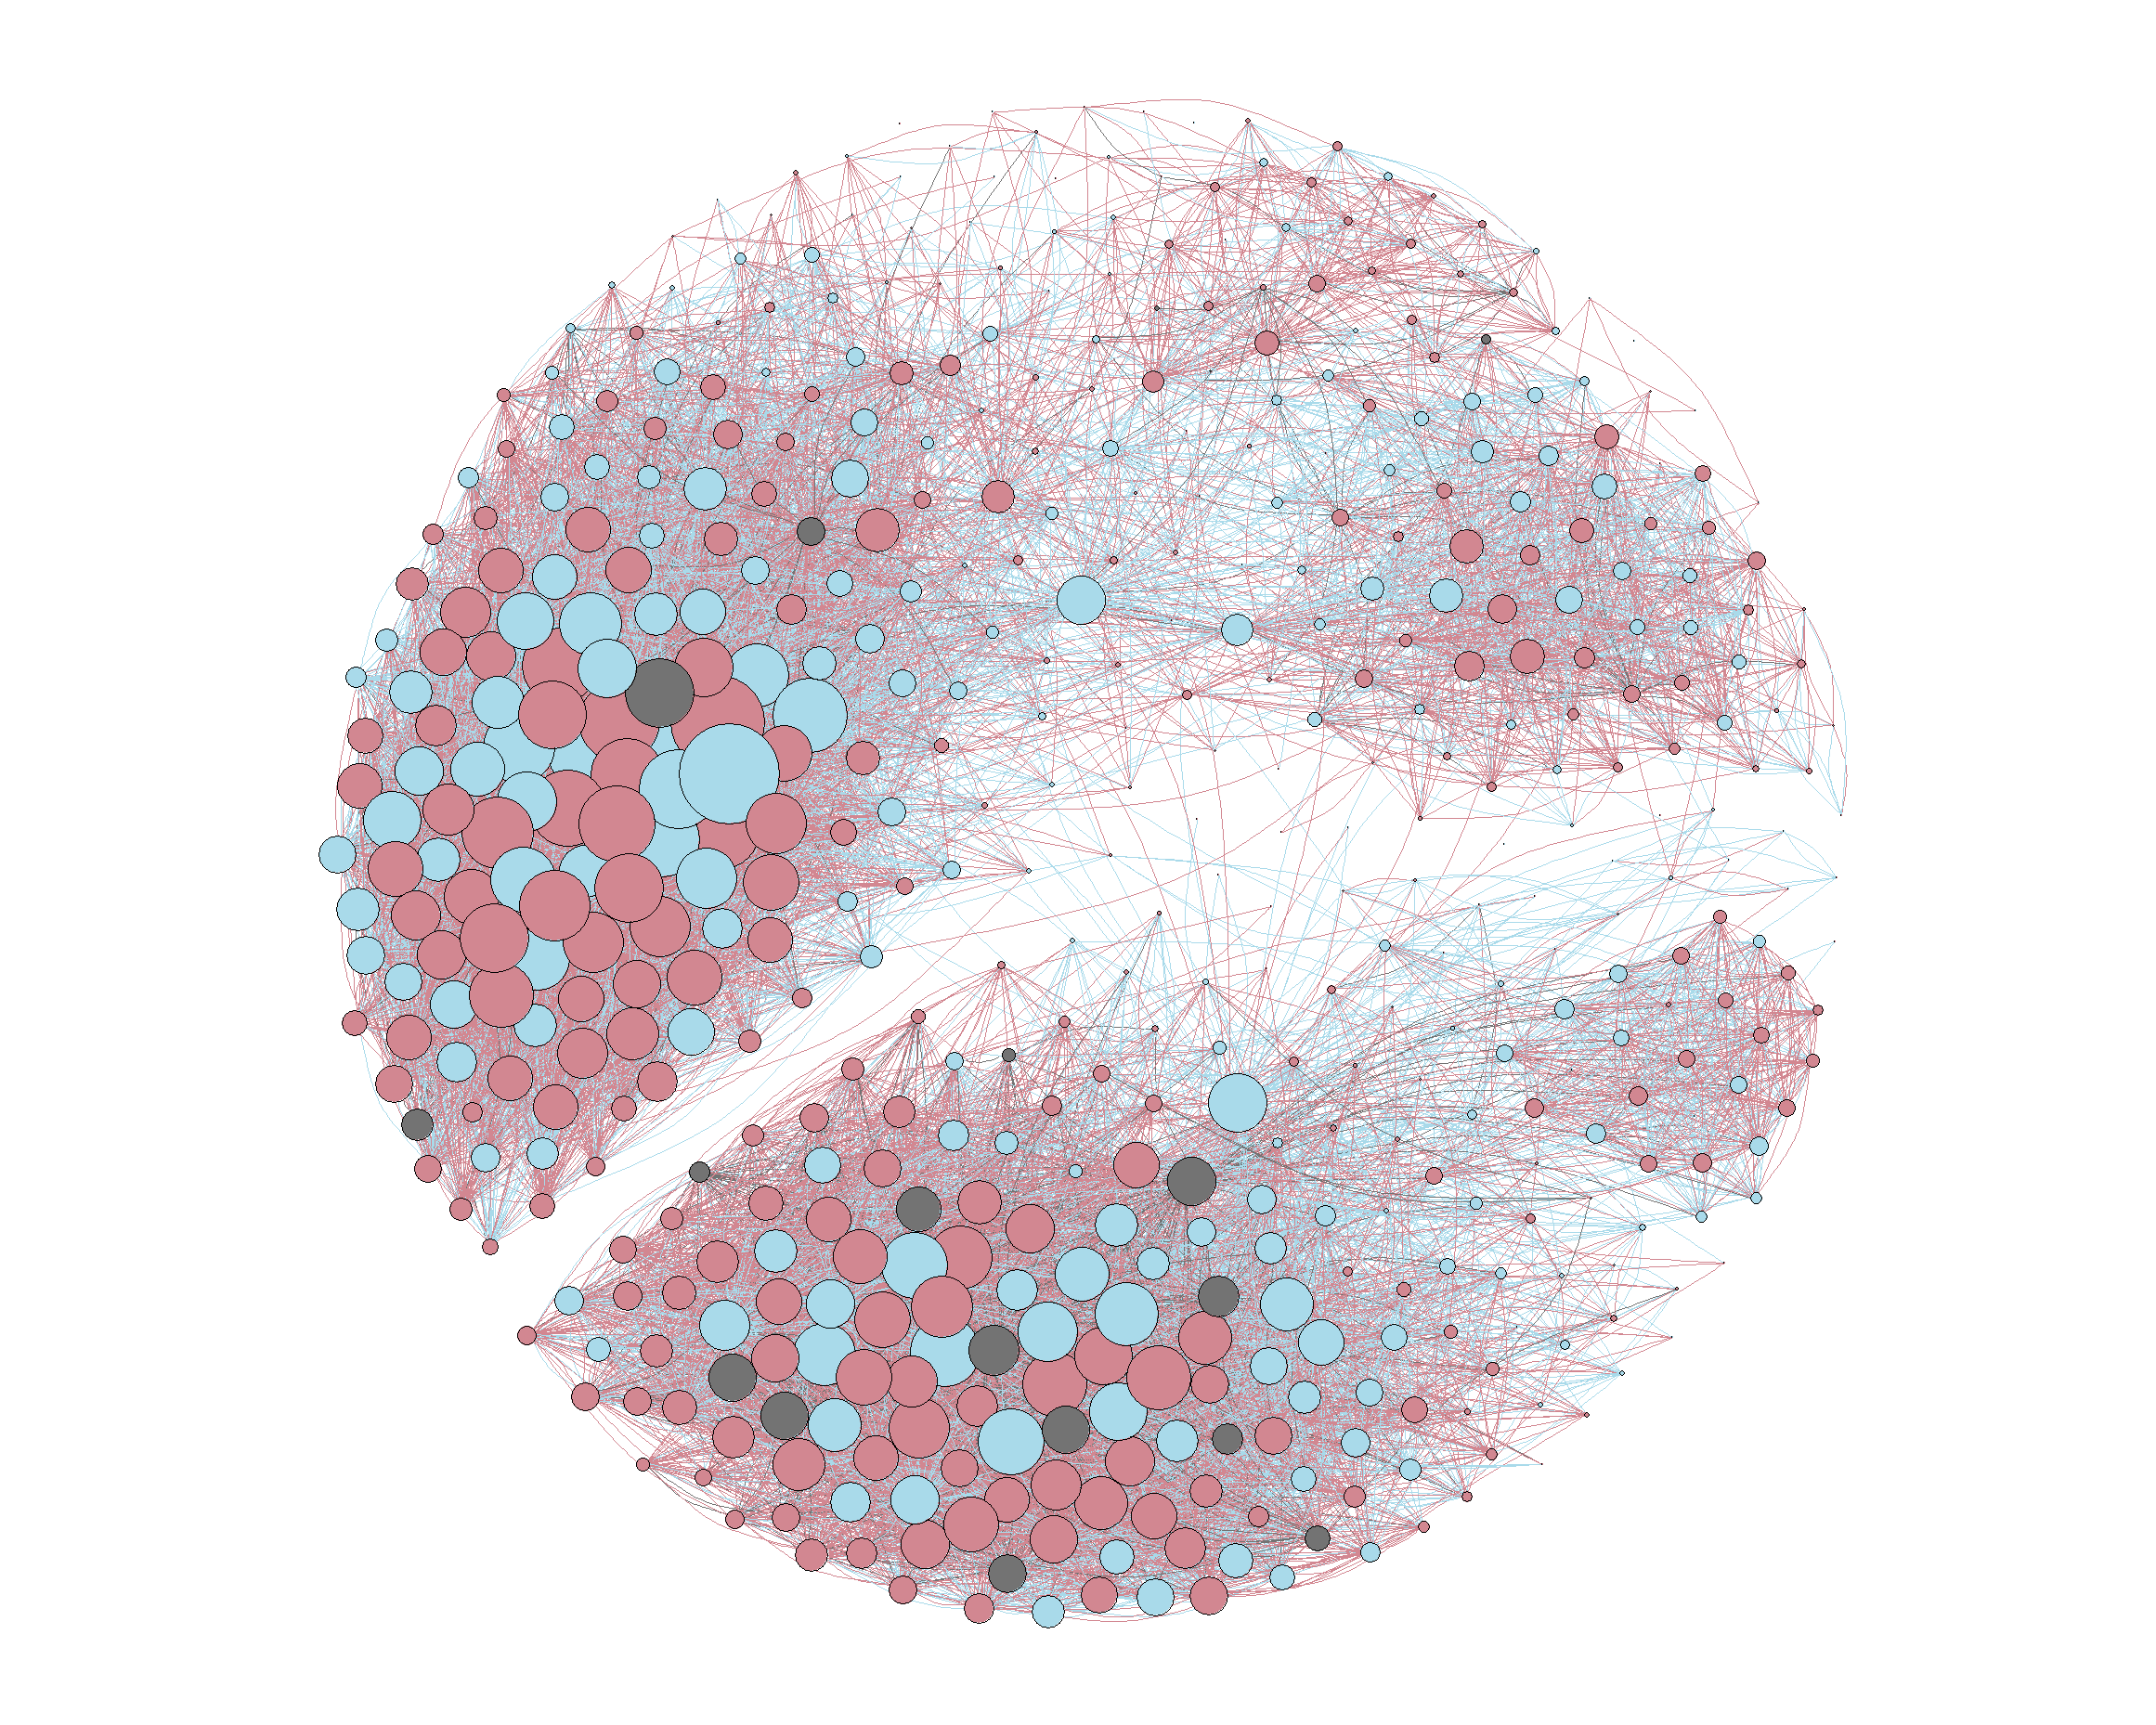
# Add node degree, node colors based on gender, and
# edge colors based on the color of the source node.
my.friends$degree <- degree(fb.net)
my.friends$color <- "gray45"
my.friends$color[my.friends$gender=="female"] <- "lightpink3"
my.friends$color[my.friends$gender=="male"] <- "lightblue"
fb.net.el$color <- my.friends$color[match(fb.net.el$Source, my.friends$name)]
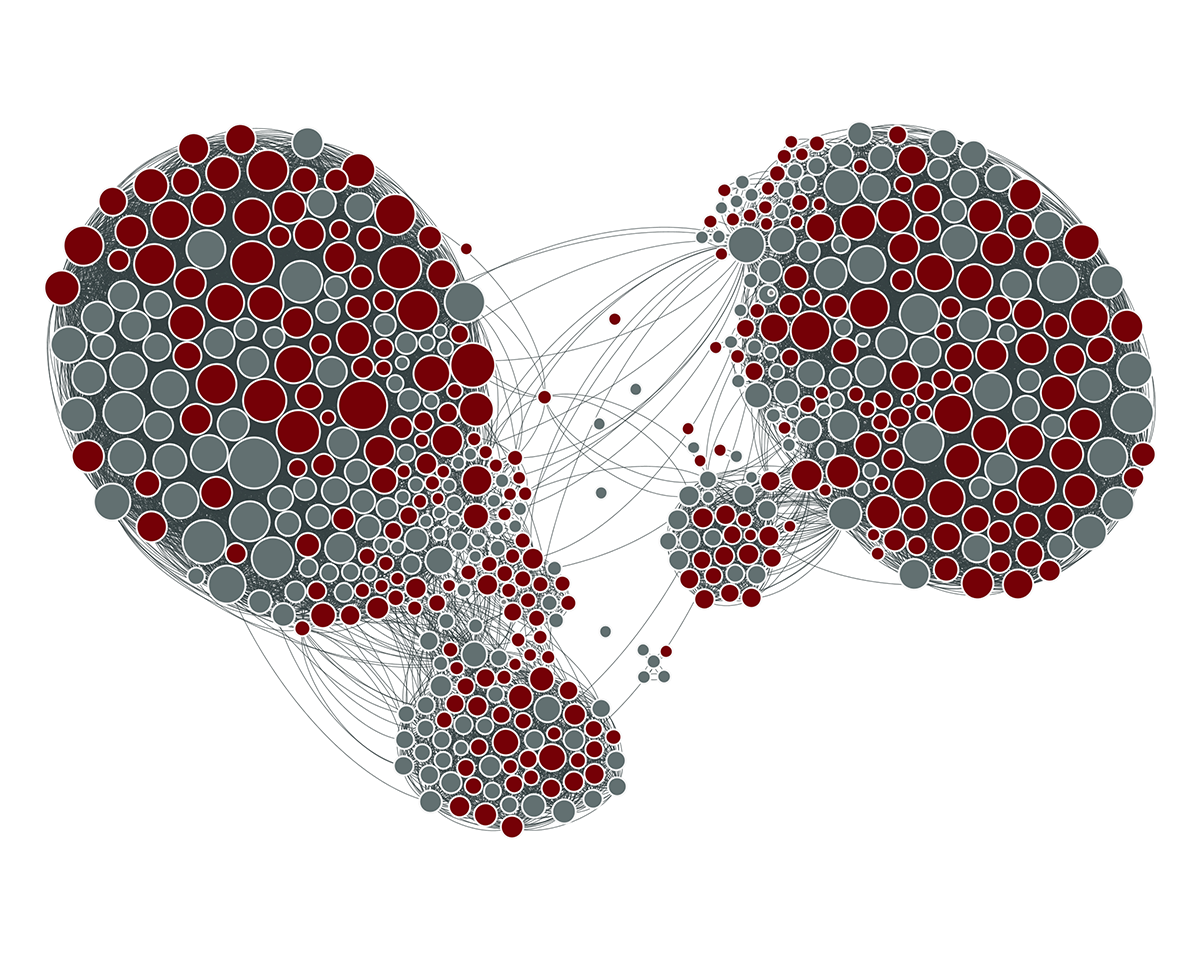
l <- layout.fruchterman.reingold(fb.net, niter=10000,area=vcount(fb.net)^2.3,
repulserad=vcount(fb.net)^2.2)
png("Facebook-friends-net-IGRAPH.png", width = 2500, height = 2000)
plot(fb.net, vertex.size=my.friends$degree/20, vertex.label=NA,
vertex.color=my.friends$color, edge.color=fb.net.el$color,
edge.width=1, edge.arrow.size=0, edge.curved=0.3, layout=l)
dev.off()
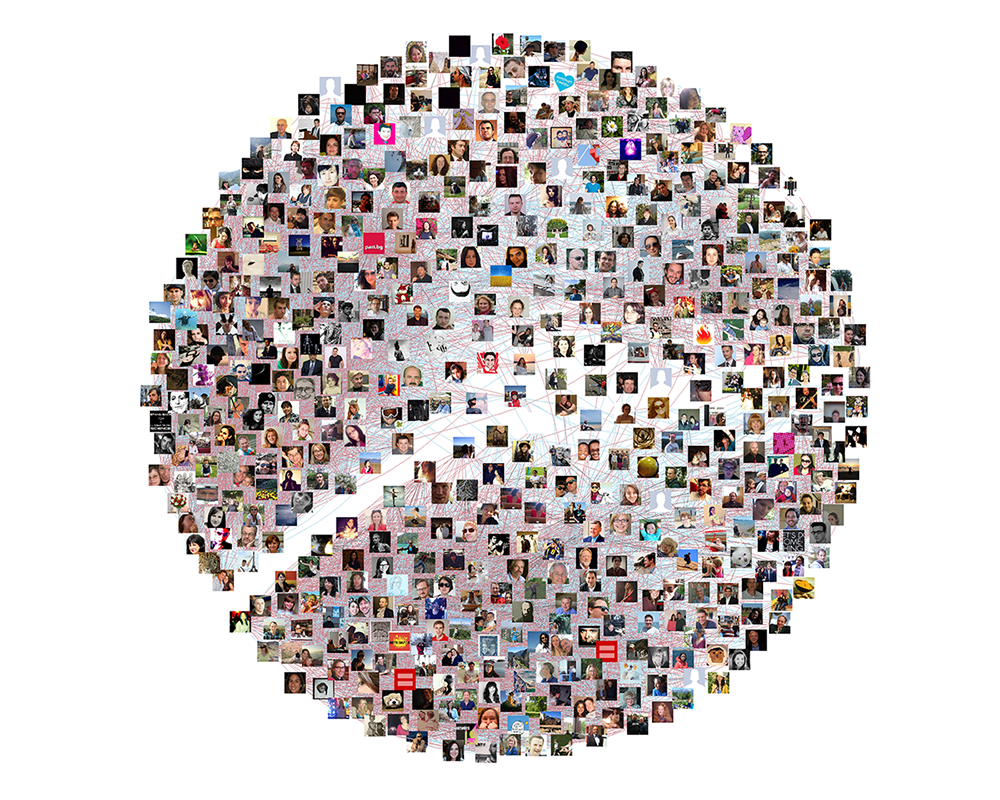
On to plotting with images – we’ll apply the layout l we created above and plot the graph, but this time with white squares for nodes. Then we’ll use the coordinates returned from the layout function to overlay the photos on top of those white squares. One thing that took a bit to figure out (got it thanks to a comment left somewhere on the interwebs by qgraph author Sacha Epskamp) is that the layout needs to be rescaled to [-1,1] first.
# Rescale the layout so it goes from -1 to 1
l <- layout.norm(l, -1, 1, -1, 1)

png("Facebook-friends-net-IGRAPH.png", width = 2500, height = 2000)
plot(fb.net, vertex.size=4, vertex.label=NA, edge.color=fb.net.el$color,
     vertex.shape="square",vertex.color="white", vertex.frame.color="white",
     edge.width=1, edge.arrow.size=0, edge.curved=0.2,  layout=l)

img.sc <- 0.03 #Image scaling
for (i in 1:dim(l)[1]) {
  img <- my.friends$picture.dld[i]
  img <- if(grepl(".jpg", img)) readJPEG(img) else "gray20"
  rasterImage(img, l[i,1]-img.sc, l[i,2]-img.sc, l[i,1]+img.sc, l[i,2]+img.sc)
}
dev.off()
detach(package:igraph)
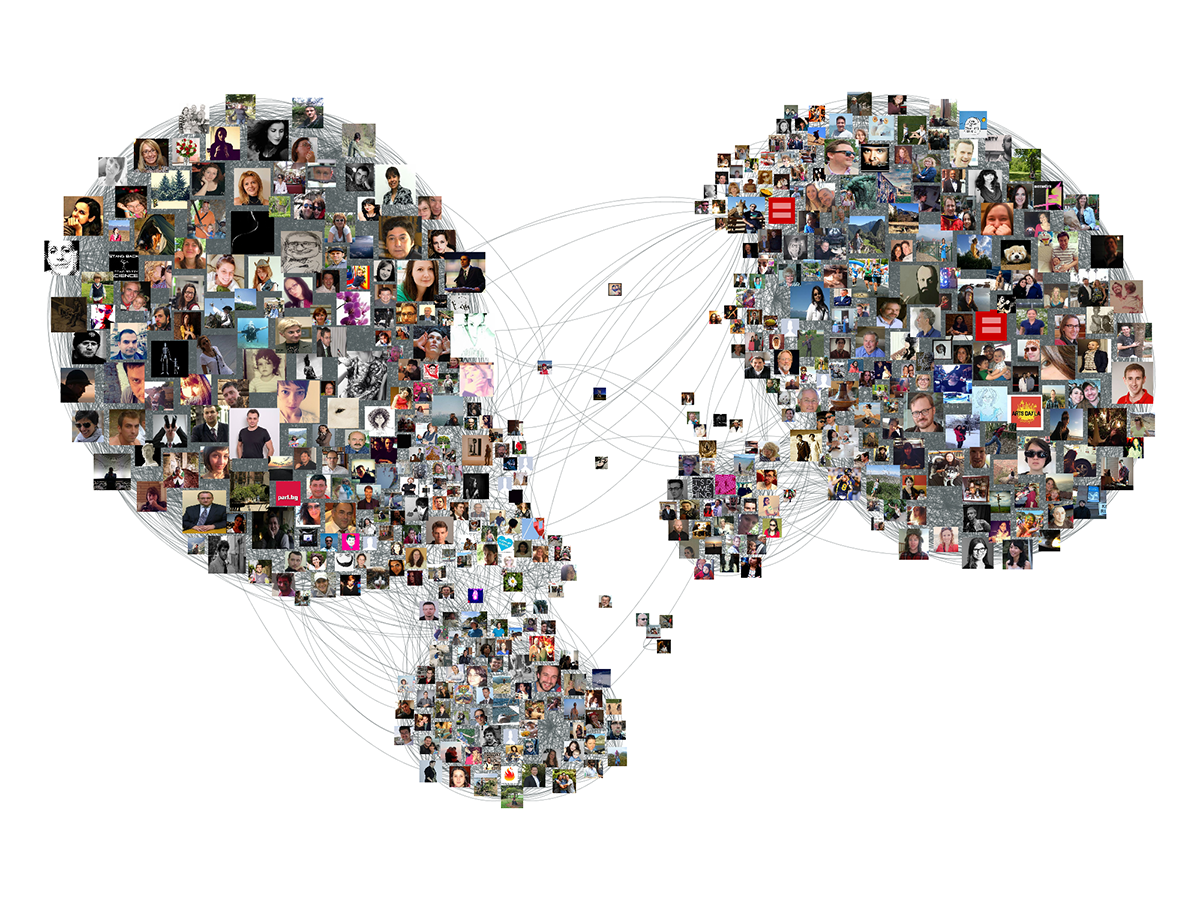
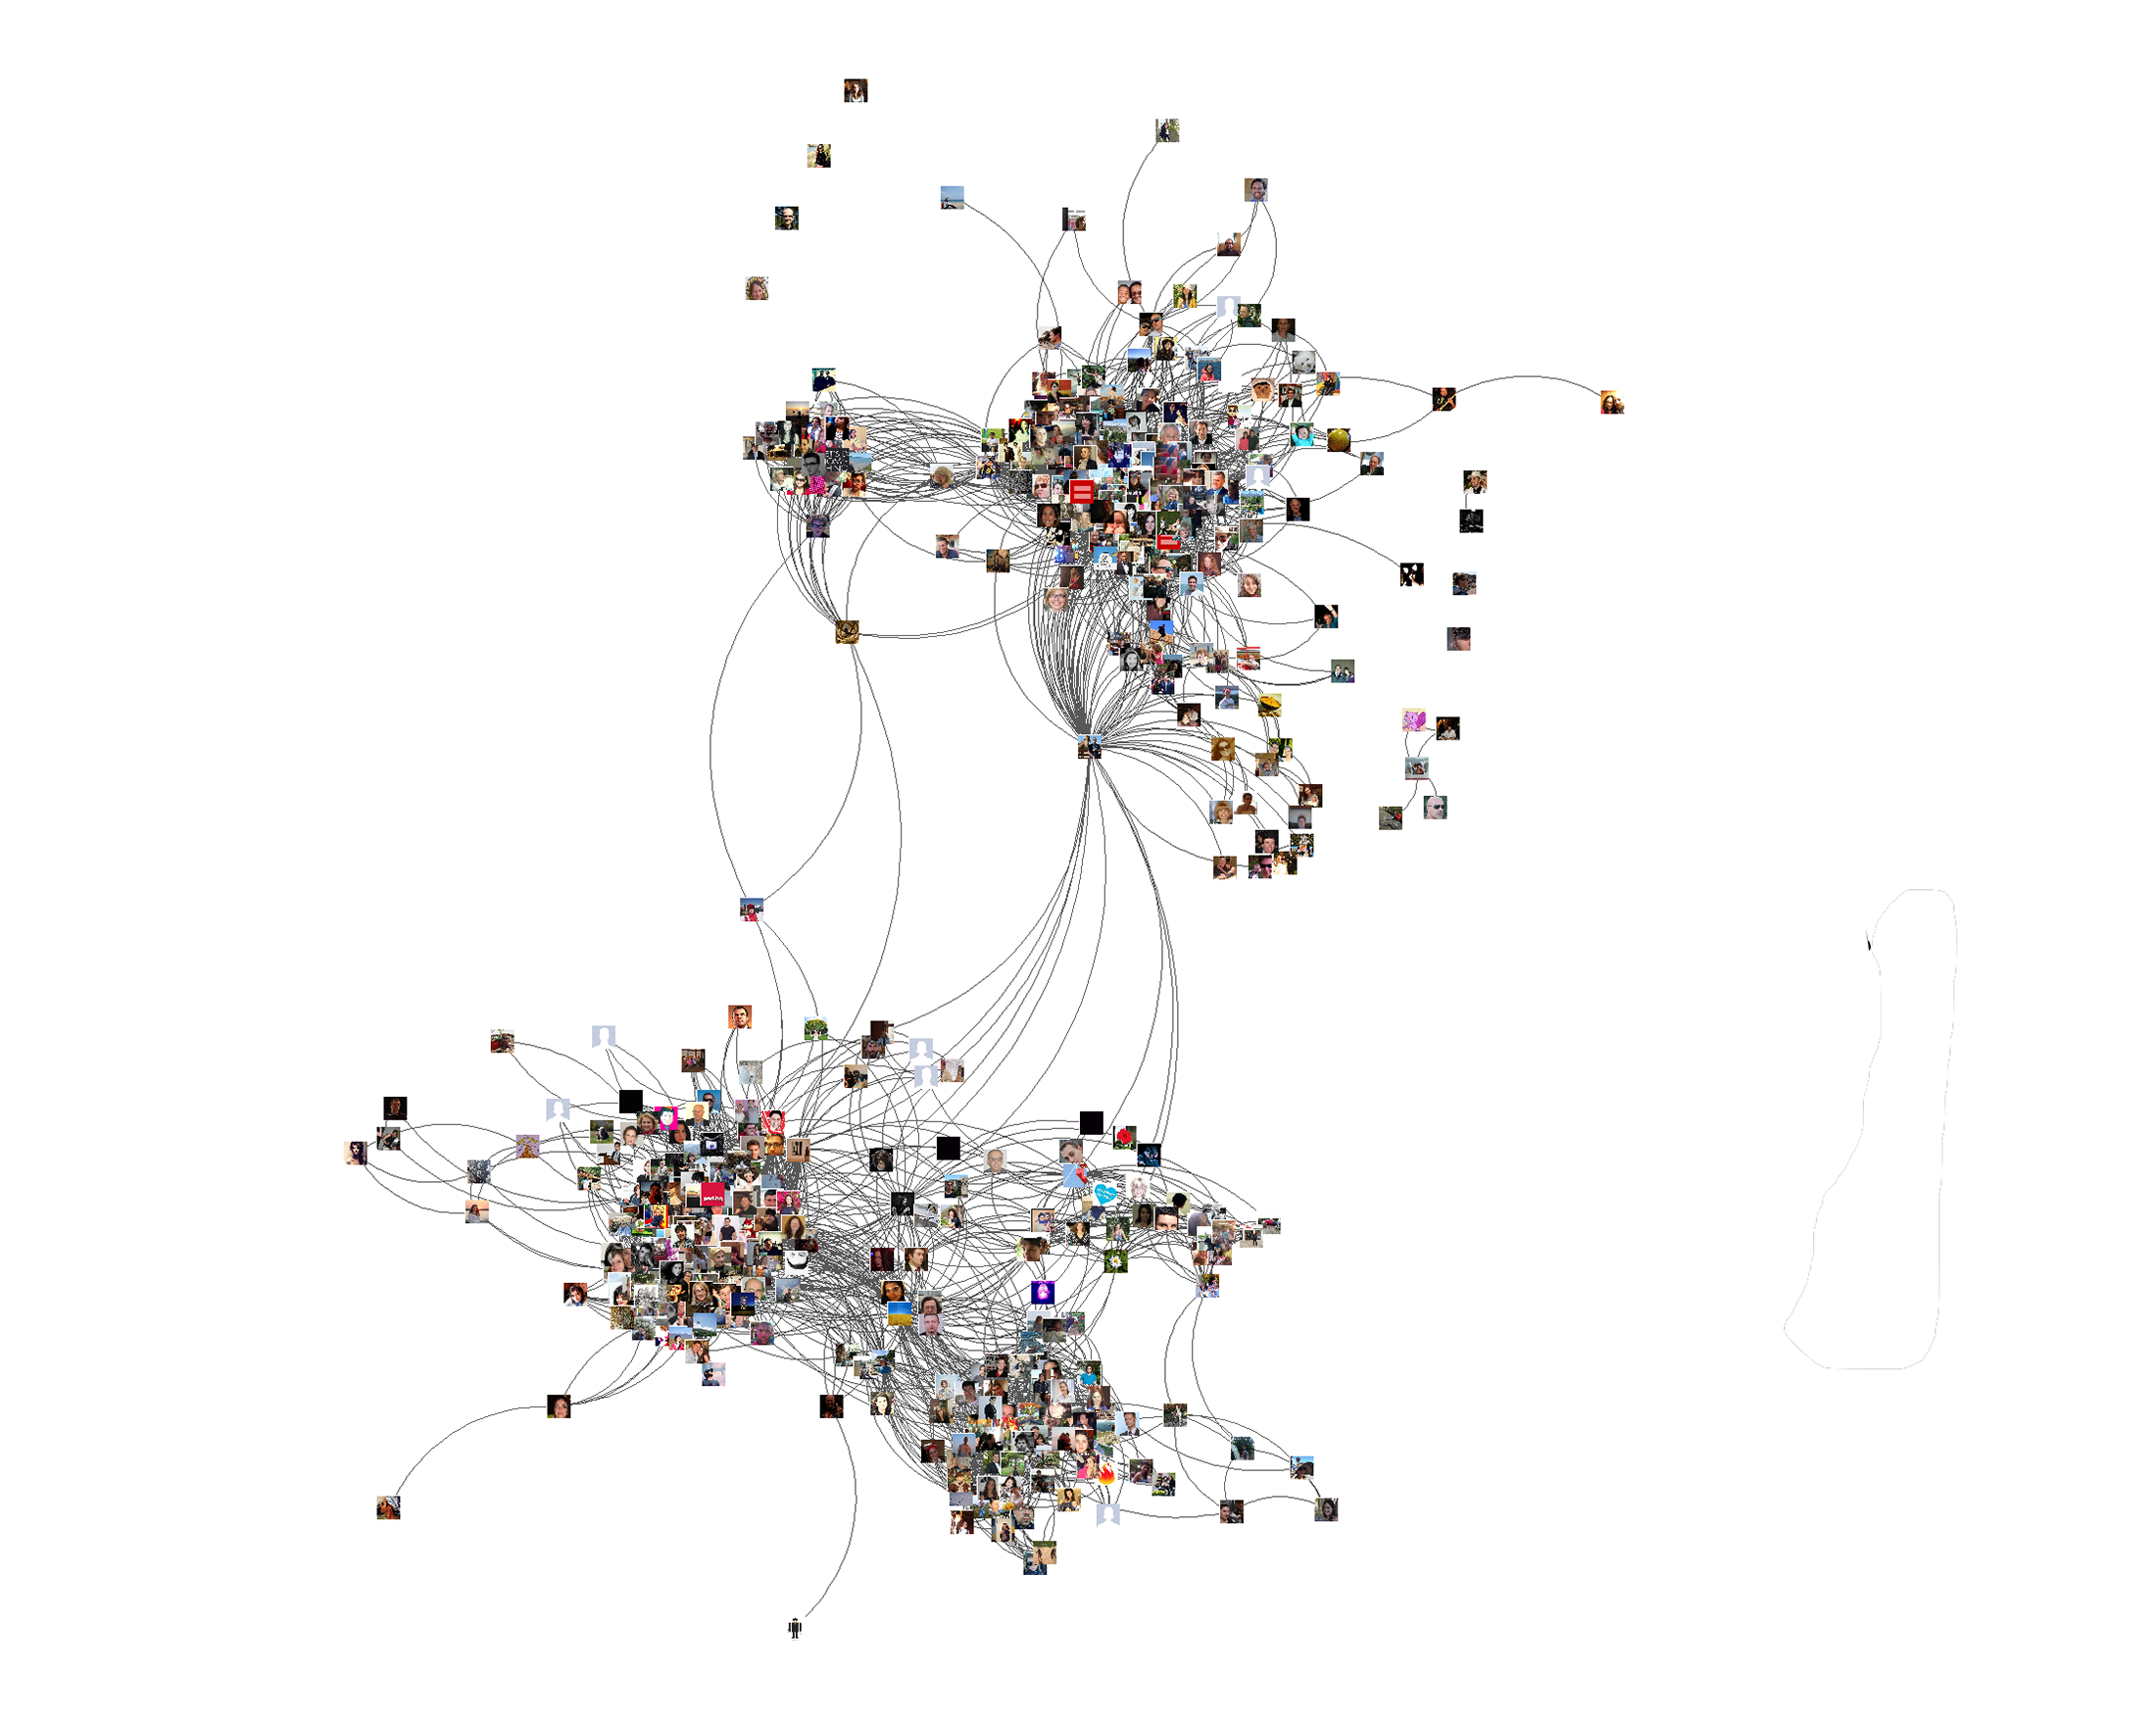
And that’s what the exported image files look like:
Visualizing the network with qgraph
There’s really not much to explain here: node images are a built-in option for qgraph. The qgraph function will take a matrix and a vector of image names(with paths), and will produce a graph with node images right away without any further tinkering.
require("png")
require("qgraph")

png("Facebook-friends-net-2014-04-QGRAPH.png", width = 2500, height = 2000)
qgraph(fb.net.mat, images = my.friends$picture.dld, labels = F,
        borders = F, esize=0.1, curve=0.2, curveAll=T, edge.color="gray55")
dev.off()

detach(package:qgraph)